JM-QALYs
The JM-QALYs project aims at proposing adequate tools to study the clinical usefulness of treatment/intervention using the expected numbers of QALYs as outcome.
Causal Inference and Prediction in
Cohort-Based Analyses
The RISCA package proposes numerous functions for cohort-based analyses, either for prediction or causal inference.
For causal inference, it includes Inverse Probability Weighting and G-computation for marginal estimation of an exposure effect when confounders are expected. We deal with binary outcomes, time-to-event data, competing events, and multi-state data. For multistate data, semi-Markov model with interval censoring may be considered and we propose the possibility to consider the excess of mortality related to the disease compared to reference lifetime.
For predictive studies, we propose a set of functions to estimate time-dependent receiver operating characteristic (ROC) curves with the possible consideration of right-censoring times-to-events or the presence of confounders. Finally, several functions are available to assess time-dependent ROC curves or survival curves from aggregated data.
Online calculators
We developed and validated several prognostic scores in concrete clinical contexts:
- KTFS is a prognostic score of kidney recipient return-to-dialysis computed at 1-year post-transplantation
Link to KTFS Read the publication
- 1-RRS is a prognostic mortality scores in kidney transplant recipients calculated at 1-year post-transplantation
Link to 1-RRS Read the publication
- 1-RBI is a diagnostic score of abnormal histology on renal transplant biopsy at 1-year post-transplantation
Link to 1-RBI Read the publication
- SMILE is a clinical-based model for predicting the risk of residual disability at 6 months post-relapse in Multiple Sclerosis
Link to SMILE Read the publication
- DynPG is a dynamic predictive score of patient and graft failure risk that could be updated continuously during patient follow-up
Link to DynPG Read the publication
- DynHFH is a dynamic predictive score of heart failure hospitalization for diabetic patients
Link to DynHFH Read the publication

Stata commands in Psychometrics
The SPHERE unit has developed many Stata commands in psychometrics field. These commands are made available on the PRO-online project website. This project aims at proposing to students or researchers a way to perform analyses in the field of Classical Test or Item Response Theories on their own data, in a user-friendly manner, without complex handling of the data.

Click on the categories below to see available commands and their description.
- raschtest : Estimation of the parameters of a Rasch model, computation of fit tests and creation of specific graphs.
- pcm : Estimation of the parameters of the Partial Credit Model and creation of graphs.
- loevh : Estimation of Loevinger's H coefficients and nonparametric Item Responses Models
- rsoort : Identification of response shift based on Structural Equation Modeling
- rosali : Identification of response shift at item-level based on Rasch models
- validscale : Assessment of the validity and reliability of a multidimensional measurement scale
- raschpower : Estimation of the power of the Wald test in the context of the Rasch model or the Partial Credit Model: comparison of the means of two groups of patients (cross-sectional) or the means of one group of patients between two times of measurement (longitudinal)
- MSP : Mokken scale procedure (Automated Item Selection Procedure)
- CLV : Clustering around Latent Variables
- HCAvar : Hierarchical Cluster Analysis of Variables
- simirt : Simulation of IRT models
- sf36fr : Computation of the SF-36 scores
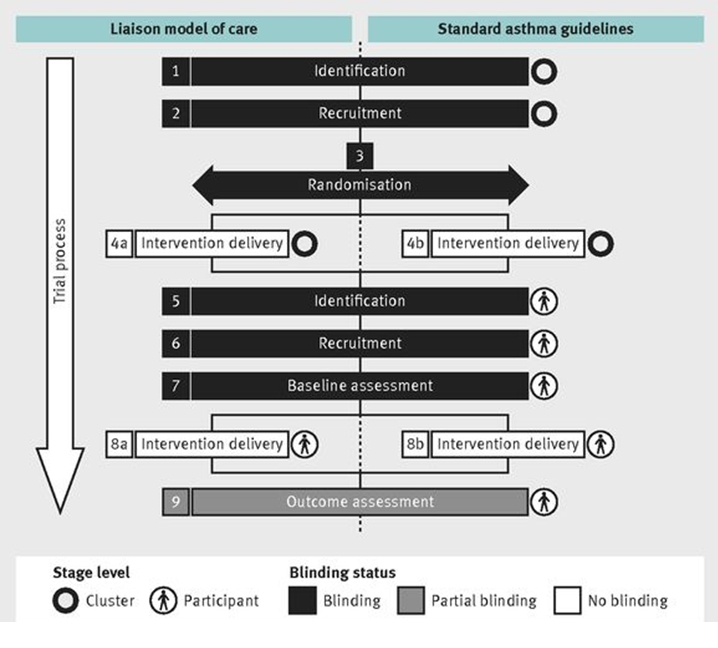
Timeline Cluster
Timeline Cluster is a graphical tool depicting the time sequence and blinding status of the different stages of a cluster randomised trial, together with examples to help researchers describe the storyline of such trials. The tool allows to clarify the trial process and to help identify the risk of bias.

